thunder4d.diagnostics
All functions take grid and a field Aw in \((x, y, \Omega)\) (FFT order) and
return sorted axes. Wavelength-resolved densities are per unit wavelength unless
per_lambda=False.
Basic quantities
- thunder4d.diagnostics.spectral_support(grid, Aw, rel=1e-4)[source]
Indices of the frequencies carrying more than
rel× the peak spectral energy.
Near field and far field
Note
Far field = the cell centre (focus / waist plane): the plane where the field is stored,
so profiles_1d(), spectrogram_x_lambda(), … describe the far field.
Near field = the collimated beam, i.e. the angular spectrum of the cell-centre field
(\(x_\text{out} = f\,\theta\) after a collimating lens of focal length \(f\)):
near_field(), near_profiles_1d() and spectrogram_theta_lambda().
- thunder4d.diagnostics.near_field(grid, Aw, theta_max=None, n_theta=None, idx=None, theta_y=None)[source]
Angular spectrum \(E(\theta_x, \theta_y, \Omega)\) on an angle grid common to all colours, computed exactly with a per-colour matrix Fourier transform. This is what is seen after collimating the output with a lens of focal length \(f\), at \(x = f\theta\).
- Parameters:
theta_max (float) – default: half the largest \(k_x\) at \(\lambda_0\)
n_theta (int) – default: an odd number, so \(\theta = 0\) is sampled
theta_y – restrict to given \(\theta_y\) values, e.g.
[0.]
- Returns:
(theta_x, Ef),Efof shape(n_theta, len(theta_y), Nt)
Spatio-spectral traces
- thunder4d.diagnostics.spectrogram_x_lambda(grid, Aw, y0=0.0, slit=None, axis='x', per_lambda=True)[source]
Imaging-spectrometer trace along a line, optionally integrated over a slit of width
slitaroundy0.- Returns:
(x, lam, S[x, lam])
- thunder4d.diagnostics.spectrogram_theta_lambda(grid, Aw, theta_max=None, n_theta=None, per_lambda=True)[source]
Angle-resolved spectrum at \(\theta_y = 0\).
- Returns:
(theta, lam, S[theta, lam])
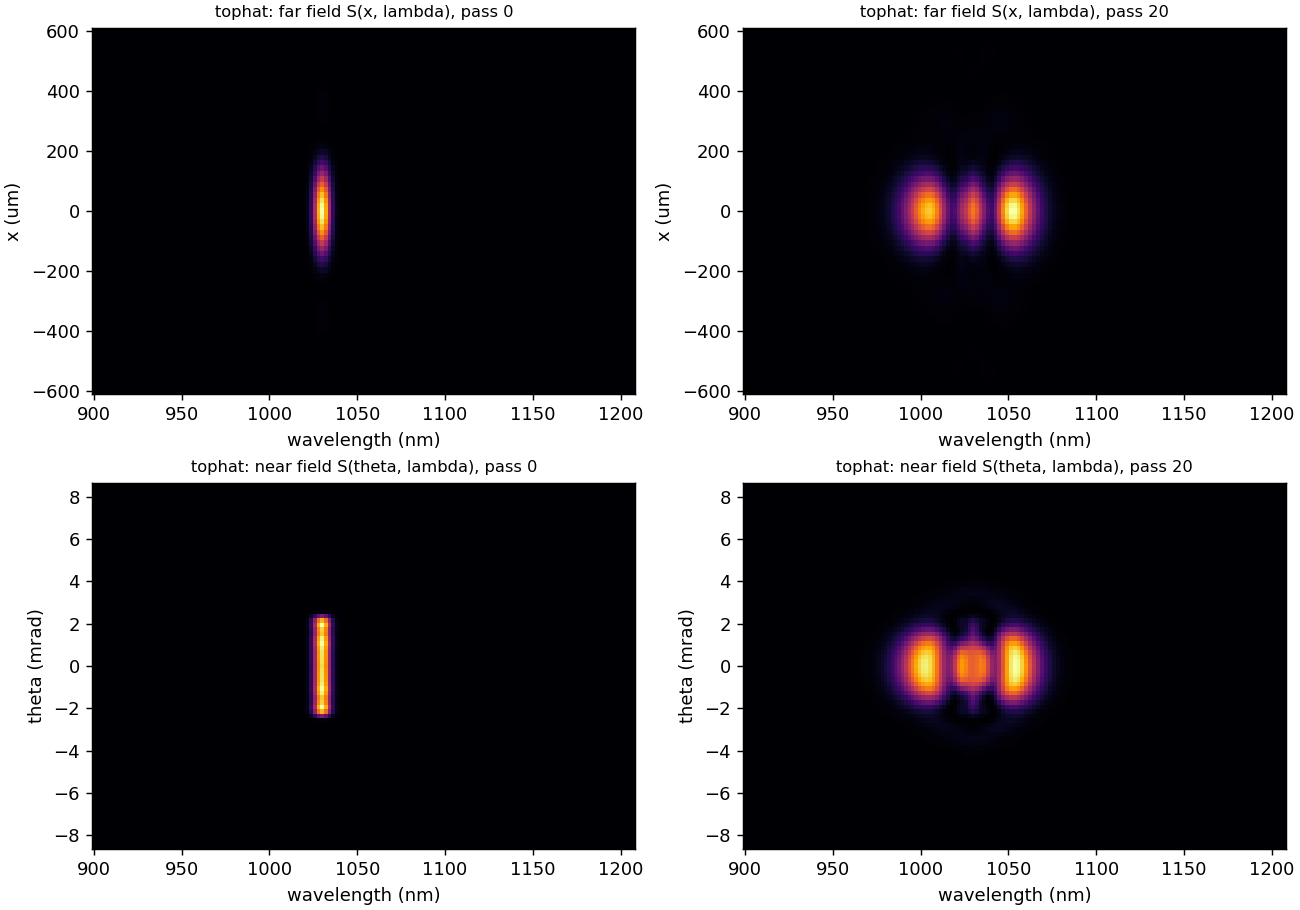
Fig. 9 \(S(x,\lambda)\) (top) and \(S(\theta,\lambda)\) (bottom), input and output.
Wavelength-resolved profiles
- thunder4d.diagnostics.band_indices(grid, lam_c, bandwidth=0.0)[source]
Frequency indices inside \([\lambda_c - bw/2, \lambda_c + bw/2]\) (nearest bin if
bandwidth= 0).
- thunder4d.diagnostics.profiles_1d(grid, Aw, wavelengths, bandwidth=0.0, axis='x', mode='cut')[source]
1D beam profiles of selected wavelength bands plus the global (spectrally integrated) profile.
- Parameters:
mode (str) –
"cut"(line through the axis) or"integrated"(projection, like a 1D camera lineout)- Returns:
(coord, profiles[n_lambda+1, N], band_energy[n_lambda+1]); the last row / entry is the global profile / total energy [J]
Homogeneity
- thunder4d.diagnostics.homogeneity(grid, Aw=None, S_xyw=None, rel=1e-3)[source]
Spectral homogeneity of each pixel against the total spectrum \(S_0\):
\[V(x, y) = \frac{\left(\sum_\lambda \sqrt{S(x,y,\lambda)\,S_0(\lambda)}\right)^2} {\sum_\lambda S \;\sum_\lambda S_0}.\]\(V = 1\) is perfectly homogeneous. Pixels below
rel× the peak fluence are NaN. Instead of a field, an intensity cubeS_xywcan be given, e.g.abs(Ef)**2fromnear_field(), for the near-field (collimated beam) homogeneity.- Returns:
(V_map, V_mean),V_meanfluence-weighted
Modal content
- thunder4d.diagnostics.mode_content(grid, Aw, w0_of_lambda, max_order=6, idx=None)[source]
Hermite–Gauss decomposition, frequency by frequency, on modes of waist
w0_of_lambda(lam)with a flat phase (exact at the cell centre).- Returns:
dict with
lam,eta00(HG₀₀ fraction per wavelength),eta00_total,order_frac(energy fraction per order \(m+n\); the last bin holds everything abovemax_order)
Beam size and beam quality
- thunder4d.diagnostics.lg_mode_content(grid, Aw, w0_of_lambda, p_max=2, l_max=2, idx=None)[source]
Decomposition on Laguerre-Gauss modes \(\mathrm{LG}_{pl}\) (\(e^{il\varphi}\) convention, waist
w0_of_lambda(lam), flat phase), spectrally integrated. Returnsp(\(0..p_{max}\)),l(\(-l_{max}..l_{max}\)),frac[p, l](fraction of the total energy per mode) andresidual(energy outside the listed modes).
- thunder4d.diagnostics.beam_moments(grid, Aw, idx=None)[source]
Per wavelength: second-moment radii
wx,wy[m] andM2x,M2yfrom the Wigner moments \(M^2 = 2\sqrt{\langle x^2\rangle\langle k_x^2\rangle - \langle x k_x\rangle^2}\) (centroids removed). Also returnslamand the spectrally weightedM2x_mean,M2y_mean.Note
Second-moment quantities are sensitive to far wings: hard edges and Airy rings inflate \(M^2\).
Compression and chirp maps
- thunder4d.diagnostics.compress(grid, Aw, gdd_bounds_fs2=(-30000, 30000), tod_fs3=0.0, n_scan=61, rel=1e-4)[source]
Uniform GDD (e.g. chirped mirrors) maximising the peak of the spatially integrated power: coarse scan, then golden-section refinement.
tod_fs3adds a fixed TOD.- Returns:
dict with
gdd_fs2,t_fs,P(compressed \(P(t)\) [W]),fwhm_fs,tl_fwhm_fs(spatially resolved transform limit),peak_power,peak_power_TL,gdd_scan_fs2,peak_scan