Grebing et al. 2020: 1 mJ, 200 fs, Ar 700 mbar, 26 passes
1 mJ, 200 fs, Ar 700 mbar, 26 passes (Grebing et al., Opt. Lett. 45, 6250, 2020)
Paper: C. Grebing et al., Opt. Lett. 45, 6250 (2020), 10.1364/OL.408998
Checks: 11 within tolerance, 0 outside
Paper and model
From the docstring of the script: what the paper describes, what the simulation uses, and what it leaves out.
Benchmark: 1 mJ, 200 fs, argon-filled Herriott cell (lens-frame solver).

C. Grebing, M. Müller, J. Buldt, H. Stark, J. Limpert, "Kilowatt-average-power compression of
millijoule pulses in a gas-filled multi-pass cell", Opt. Lett. 45, 6250 (2020),
doi:10.1364/OL.408998 (open access: arXiv:2103.00893).

Clean, textbook SPM stage in the mJ range: moderate peak power (~4.5 GW, P/Pc ~ 0.2), dielectric
mirrors. The input follows the authors' own simulation of this stage (Müller et al., Opt. Lett. 46,
2678, 2021): Gaussian beam, Gaussian 200 fs pulse of 994 uJ with a TOD of -1e4 fs^3.

                 paper                                          used here
mirrors          RoC 0.6 m, R > 99.95 %, |GDD| < 50 fs^2         R = 0.9995, GDD = +35 fs^2, band
                 over 970-1130 nm                               edges 10 nm outside (assumption)
geometry         d = 1183 mm, 26 passes, re-entrant              herriott(R=0.6, N=26, k=1)
eigenmode        0.30 mm diameter at focus, 2.5 mm on mirror    computed
gas              Ar 700 mbar, n2 = 1e-23 m^2/W at 1 atm          same
injection        linear eigenmode                                same
compressor       6 chirped mirrors, -1923 fs^2                   same GDD

Measured: -20 dB width ~120 nm, Fourier limit 27 fs, compressed 31 fs (autocorrelation), 96 %
transmission (cell + compressor), M2 < 1.15, weighted homogeneity 98.7 % (x) / 99.4 % (y).
Not modelled: folded off-axis geometry, windows, measured input spectrum and phase.

Usage: python bench_grebing2020_1mJ.py [--quick] [--device gpu] [--set n2_1bar=1.1e-23] ...
       (python bench_grebing2020_1mJ.py -h for all options)
Reference run
run |
|
code |
thunder4d 1.0.0, git |
grid |
Grid 72x72x120 (5 MB per field, cpu/scipy) | box 1.30 x 1.30 mm, dx = 18.1 um | T = 1695 fs, dt = 14.13 fs | lambda window 920-1173 nm |
steps |
phi_max = 0.02 rad, gouy_step = 0.05 rad, 1559 steps |
run time |
26 passes in 0.8 min (cpu, scipy) |
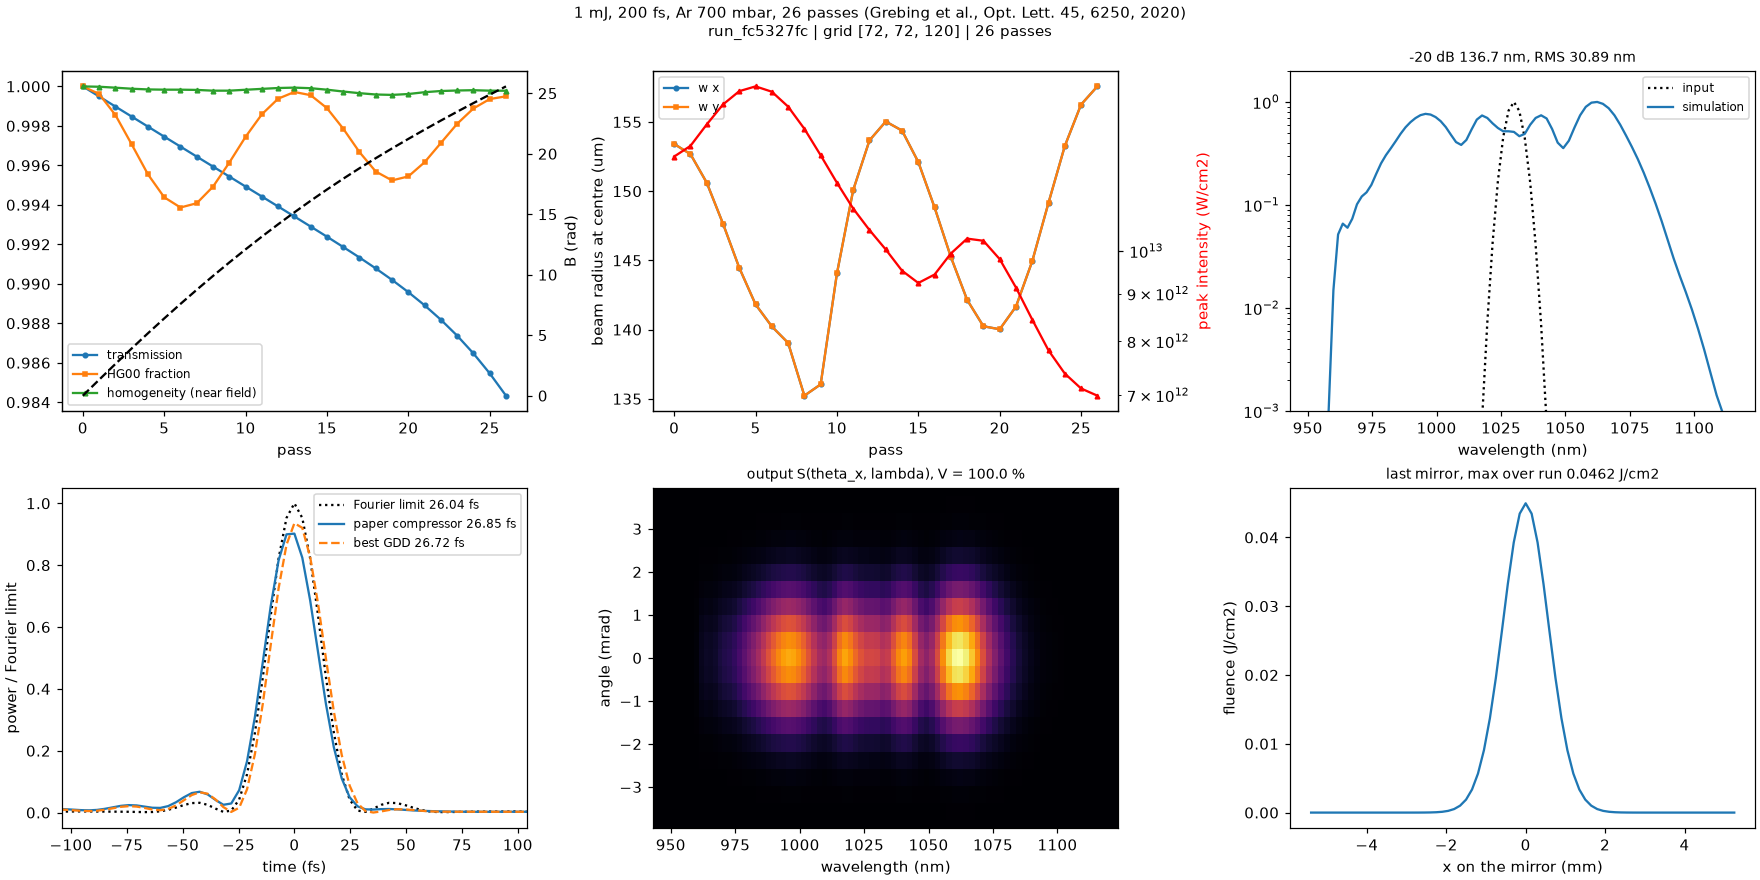
Fig. 5 Standard figure of the reference run. Top: transmission, HG₀₀ fraction, homogeneity and B-integral vs pass; beam radius and peak intensity at the cell centre; output spectrum (with the measured or published spectrum when available). Bottom: compressed pulses vs the Fourier limit; output spatio-spectral trace S(θ, λ); fluence on the last mirror.
Comparison with the paper
output |
simulation |
paper |
deviation |
status |
description |
|---|---|---|---|---|---|
|
153.4 um |
150 ±5% |
+2 % |
ok |
linear eigenmode waist (1/e2 radius) (0.30 mm diameter) |
|
1273 um |
1250 ±5% |
+2 % |
ok |
linear mode on mirror (1/e2 radius) (2.5 mm diameter) |
|
0.9843 |
0.96 ±0.03 |
+3 % |
ok |
cell transmission (cell + compressor in the paper) |
|
25.57 rad |
13 |
+97 % |
B-integral, on-axis peak (~13 beam-averaged) |
|
|
6.637e-07 |
< 0.001 |
-100 % |
ok |
max fluence fraction outside 70 % of the box (should be ~0) (numerical check) |
|
1.001 |
< 1.15 |
-13 % |
ok |
M2 x (spectrally weighted) |
|
1.001 |
< 1.15 |
-13 % |
ok |
M2 y (spectrally weighted) |
|
136.7 nm |
120 ±15% |
+14 % |
ok |
-20 dB spectral width |
|
26.04 fs |
27 ±10% |
-4 % |
ok |
Fourier limit (integrated spectrum) |
|
26.85 fs |
31 ±15% |
-13 % |
ok |
compressed with the paper’s -1923 fs2 (autocorrelation) |
|
0.9999 |
> 0.987 |
+1 % |
ok |
homogeneity, intensity weighted in 1/e2 (x) (measured; the ideal cell can only do better) |
|
1183 mm |
1183 ±0% |
-0 % |
ok |
mirror separation |
Other outputs
output |
simulation |
description |
|---|---|---|
|
153.4 um |
injected waist (linear) |
|
0.1936 |
input peak power / critical power |
|
32.5 rad |
B-integral, matched-mode estimate |
|
1.502e+13 W/cm2 |
max peak intensity at the cell centre |
|
0.0462 J/cm2 |
max fluence on the mirrors |
|
0.9995 |
HG00 fraction, output |
|
0.1456 |
beam-size oscillation (max-min)/w_in |
|
30.89 nm |
RMS spectral width |
|
1028 nm |
spectral centre of mass |
|
0.9019 |
peak power / Fourier limit (paper GDD) |
|
-2026 fs2 |
GDD maximising the peak power |
|
26.72 fs |
compressed with the best GDD |
|
0.9357 |
peak power / Fourier limit (best GDD) |
|
32.32 GW |
compressed peak power (best GDD) |
|
0.9998 |
min homogeneity within FWHM |
|
0.9990 |
min homogeneity within 1/e2 |
Measured data
Curves digitised from the paper, in benchmark/ (see the header of each file for the figure and the units):
none committed yet
Reproducing
cd benchmark
python bench_grebing2020_1mJ.py --device cpu
python analyze.py grebing2020_1mJ