Rueda et al. 2021: 0.29 mJ, 42 fs -> 8 fs, Ar 1500 mbar, 11 passes
0.29 mJ, 42 fs -> 8 fs, Ar 1500 mbar, 11 passes (Rueda et al., Opt. Express 29, 27004, 2021)
Paper: P. Rueda et al., Opt. Express 29, 27004 (2021), 10.1364/OE.435086
Script: benchmark/bench_rueda2021_8fs.py
Checks: 4 within tolerance, 0 outside
Note
Calibrated parameter. energy = 145 µJ instead of 290 µJ in the paper: x 0.5, as in the authors’ own simulation (pedestals, wavefront aberrations).
Paper and model
From the docstring of the script: what the paper describes, what the simulation uses, and what it leaves out.
Benchmark: 0.29 mJ, 42 fs -> 8 fs in a compact argon-filled MPC (lens-frame solver).

P. Rueda, F. Videla, T. Witting, G. A. Torchia, F. J. Furch, "8 fs laser pulses from a compact
gas-filled multi-pass cell", Opt. Express 29, 27004 (2021), doi:10.1364/OE.435086 (open access).

Few-cycle compression of a Ti:Sa CPA in a short, very concentric cell with only 11 passes, hence a
high B-integral per pass (the paper estimates 1.5 pi per round trip) and P/Pc ~ 1 at the nominal
energy. It complements the two Yb cases: 800 nm, a nearly octave-wide spectrum, self-steepening,
and visible space-time couplings, in a small cell.

                 paper                                          used here
laser            Ti:Sa CPA, 790 nm, 42 fs, nearly Fourier-      Gaussian 42 fs at 790 nm, flat phase
                 limited; 290 uJ at the first cavity mirror     (measured input not published)
energy           the authors' own 3D simulation multiplies the  energy = 0.5 x 290 uJ = 145 uJ
                 energy by 0.5 to reproduce the spectrum        (--set energy=290e-6: nominal)
                 (pedestals, wavefront aberrations)
mirrors          protected silver, RoC 300 mm, 2", R = 97 %     R = 0.97, flat, GDD = 0
                 flat in the authors' simulation
geometry         d = 584 mm, 11 passes through the focus         MPC(R=0.3, d=0.584, n_passes=11)
gas              Ar 1500 mbar, n2 from Wahlstrand 2012           Ar 1.5 bar, n2(1 bar) = 1.0e-23 m^2/W
compressor       12 bounces PC-70 + fused-silica wedges,         -480 fs^2 (assumption: -40 fs^2 per
                 after a 0.5 mm FS exit window                  bounce) + best fused-silica thickness

Measured: Fourier limit 5.0 fs in the text, but 6.2 fs for the spectrum of Fig. 3a (digitised in
data/; the simulation is compared with the latter), compressed 8.06 fs (SPIDER; limited by residual
third order), more than 6-fold broadening at 1/e, 85 % of the energy in the core of the focused
beam. The authors' simulation gives a space-time Strehl-like ratio of 0.91.
Transmission: the code counts one mirror bounce per pass (11), the experiment has 10 bounces on the
cavity mirrors; the 61.4 % chamber transmission of the paper also includes windows and steering
mirrors, so it is only shown for information.
Not modelled: ionisation (the paper suspects it explains the stronger blue shift of the measured
spectrum; the peak intensity is reported), the measured input spectrum and phase, chirped-mirror
GDD oscillations, the spectral response of the silver mirrors.

Usage: python bench_rueda2021_8fs.py [--quick] [--device cpu] [--set energy=290e-6] ...
Reference run
run |
|
code |
thunder4d 1.0.0, git |
grid |
Grid 120x120x360 (41 MB per field, cpu/scipy) | box 1.13 x 1.13 mm, dx = 9.4 um | T = 822 fs, dt = 2.28 fs | lambda window 450-1307 nm |
steps |
phi_max = 0.02 rad, gouy_step = 0.05 rad, 1292 steps |
run time |
11 passes in 6.0 min (cpu, scipy) |
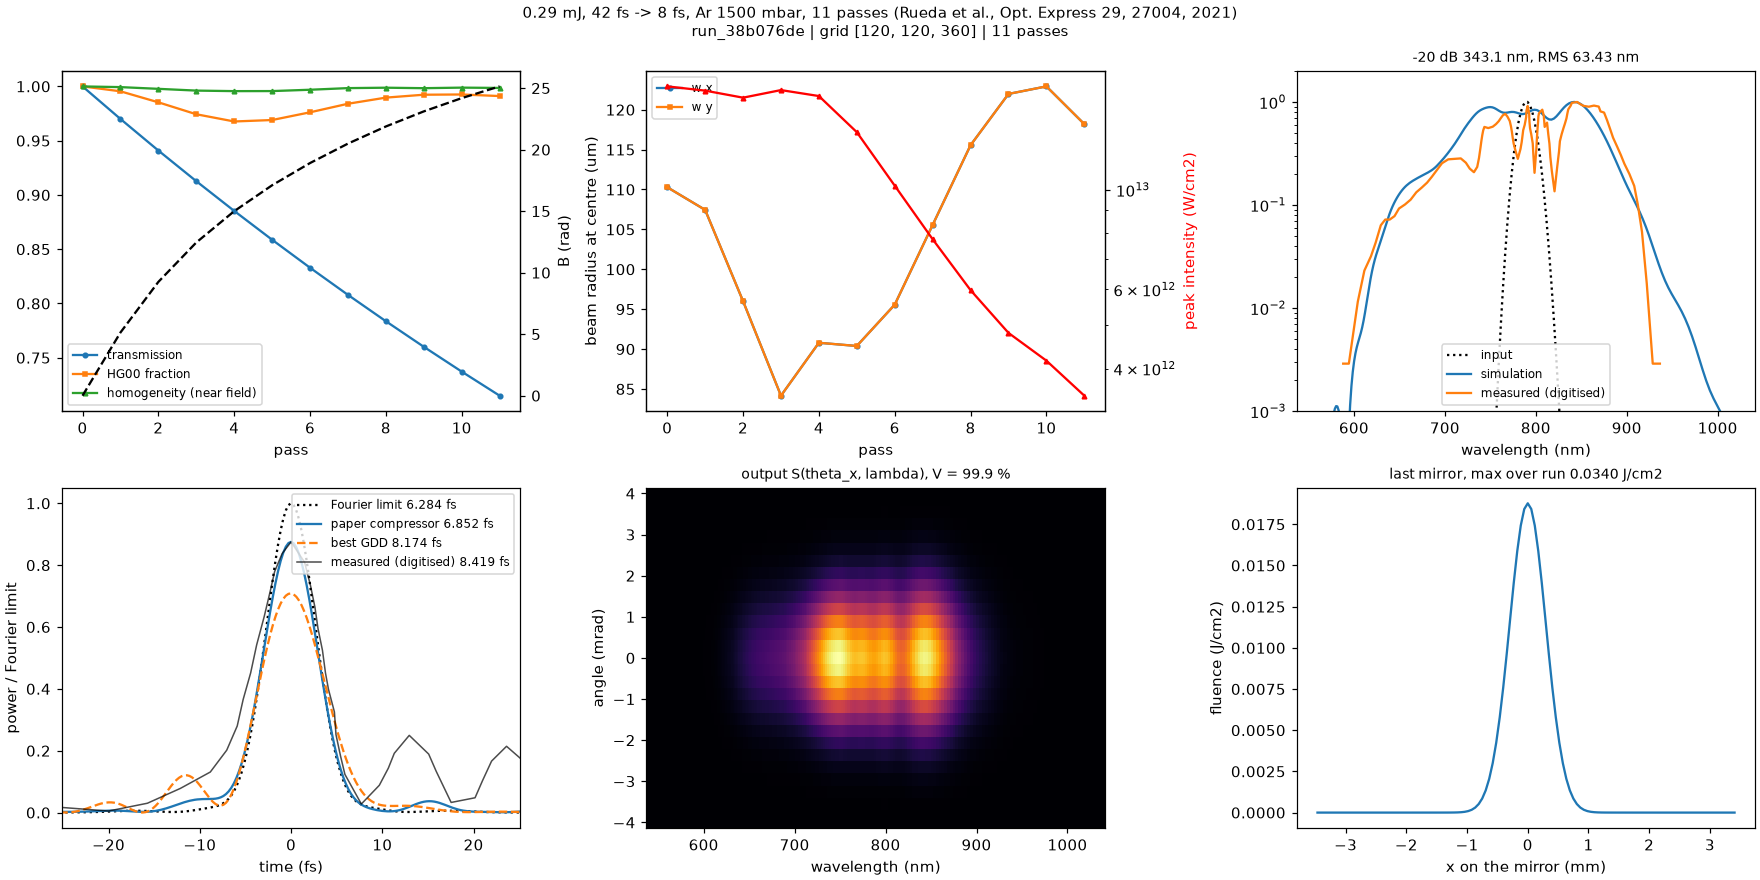
Fig. 7 Standard figure of the reference run. Top: transmission, HG₀₀ fraction, homogeneity and B-integral vs pass; beam radius and peak intensity at the cell centre; output spectrum (with the measured or published spectrum when available). Bottom: compressed pulses vs the Fourier limit; output spatio-spectral trace S(θ, λ); fluence on the last mirror.
Comparison with the paper
output |
simulation |
paper |
deviation |
status |
description |
|---|---|---|---|---|---|
|
0.7151 |
0.737 |
-3 % |
cell transmission (0.97^10; chamber incl. windows: 0.614) |
|
|
1.699e+13 W/cm2 |
< 1e+14 |
-83 % |
ok |
max peak intensity at the cell centre (Ar ionisation, order of magnitude) |
|
4.328e-08 |
< 0.001 |
-100 % |
ok |
max fluence fraction outside 70 % of the box (should be ~0) (numerical check) |
|
0.9513 |
spectral similarity with the measurement |
|||
|
6.178 fs |
Fourier limit of the measured (digitised) spectrum |
|||
|
6.284 fs |
6.2 ±10% |
+1 % |
ok |
Fourier limit (integrated spectrum) (FTL of the measured spectrum (Fig. 3a); text: 5.0 fs) |
|
8.419 fs |
FWHM of the measured (digitised) pulse |
|||
|
6.852 fs |
8.06 |
-15 % |
compressed, -480 fs2 + 6.92 mm FS (SPIDER, limited by residual TOD) |
|
|
7.444 |
> 6 |
+24 % |
ok |
spectral width at 1/e, output / input (frequency) (> 6-fold at 1/e) |
|
0.9893 |
0.85 |
+16 % |
far-field energy within diameter pi x w (1/e2 half width) (measured, focused beam) |
Other outputs
output |
simulation |
description |
|---|---|---|
|
110.2 um |
linear eigenmode waist (1/e2 radius) |
|
675 um |
linear mode on mirror (1/e2 radius) |
|
110.2 um |
injected waist (linear) |
|
0.4900 |
input peak power / critical power |
|
42.45 rad |
B-integral, matched-mode estimate |
|
25.14 rad |
B-integral, on-axis peak |
|
0.0340 J/cm2 |
max fluence on the mirrors |
|
0.9911 |
HG00 fraction, output |
|
1.003 |
M2 x (spectrally weighted) |
|
1.003 |
M2 y (spectrally weighted) |
|
0.3514 |
beam-size oscillation (max-min)/w_in |
|
343.1 nm |
-20 dB spectral width |
|
63.43 nm |
RMS spectral width |
|
779.9 nm |
spectral centre of mass |
|
-208.7 fs2 |
GDD maximising the peak power |
|
8.174 fs |
compressed with the best GDD |
|
0.7085 |
peak power / Fourier limit (best GDD) |
|
10.66 GW |
compressed peak power (best GDD) |
|
0.9994 |
homogeneity, intensity weighted in 1/e2 (x) |
|
0.9994 |
min homogeneity within FWHM |
|
0.9947 |
min homogeneity within 1/e2 |
|
0.8752 |
peak power / Fourier limit (paper compressor) |
|
6.915 mm |
fused silica needed on top of the chirped mirrors |
Measured data
Curves digitised from the paper, in benchmark/ (see the header of each file for the figure and the units):
spectrum: data/rueda2021_spectrum.csvpulse: data/rueda2021_pulse.csv
Reproducing
cd benchmark
python bench_rueda2021_8fs.py --device cpu
python analyze.py rueda2021_8fs