Kaumanns et al. 2018: 18 mJ, 1.3 ps, Ar 600 mbar, 45 passes
18 mJ, 1.3 ps, Ar 600 mbar, 45 passes (Kaumanns et al., Opt. Lett. 43, 5877, 2018)
Paper: M. Kaumanns et al., Opt. Lett. 43, 5877 (2018), 10.1364/OL.43.005877
Checks: 10 within tolerance, 2 outside
Note
Calibrated parameter. energy = 12.6 mJ instead of 18.6 mJ in the paper: effective energy: ASE / pre- and post-pulses (see paper).
Paper and model
From the docstring of the script: what the paper describes, what the simulation uses, and what it leaves out.
Benchmark: 18 mJ, 1.3 ps, argon-filled Herriott cell (lens-frame solver).

M. Kaumanns, V. Pervak, D. Kormin, V. Leshchenko, A. Kessel, M. Ueffing, Y. Chen, T. Nubbemeyer,
"Multipass spectral broadening of 18 mJ pulses compressible from 1.3 ps to 41 fs",
Opt. Lett. 43, 5877 (2018), doi:10.1364/OL.43.005877.

High-energy regime: 13 GW (P/Pc ~ 0.5), large total nonlinear phase (~55 rad from a fit of the
measured spectrum), compression factor 33, near-concentric cell close to its stability edge: the
mirror spot (2.7 mm) is 15 times the waist (185 um), which is exactly where the lens frame pays off,
the grid only has to hold the waist. The authors' SPM model of their output (Eq. 1, phi = 55 rad) is
stored as a second reference spectrum.

                 paper                                          used here
mirrors          300 x 130 mm, RoC 1.5 m, R > 99.9 % over        R = 0.999, GDD = 0, edges 10 nm
                 965-1100 nm, GDD = 0 at 1030 nm                outside the band (assumption)
geometry         d ~ 1.99 R ~ 3 m, 45 passes                     MPC(R=1.5, d=2.986): quoted eigenmode
eigenmode        0.37 mm diameter at focus, 5.4 mm on mirror    computed
gas              Ar 600 mbar, n2(1 bar) ~ (10 +- 1)e-24 m^2/W    same
input            18.6 mJ, 1.3 ps, 1.1 nm, 1030 nm               transform-limited Gaussian 1.3 ps
compressor       17 chirped mirrors, -9400 fs^2                  same GDD

Measured: 17.8 mJ out (95.7 %), Fourier limit 39 fs, compressed 41 fs with 62 % of the
Fourier-limited peak power (their model: 41.6 fs, 67 %), M2 1.17 x 1.18, weighted homogeneity
96.7 % (x) / 97.3 % (y). Variant: --set pressure_bar=0.7 --set energy=17e-3 --set lambda_min=920e-9.
Not modelled: ionisation (run just below breakdown, ~18.3 mJ at 600 mbar), ASE / pre-pulses.
Reference run
run |
|
code |
thunder4d 1.0.0, git |
grid |
Grid 72x72x500 (21 MB per field, cpu/scipy) | box 1.54 x 1.54 mm, dx = 21.4 um | T = 7956 fs, dt = 15.91 fs | lambda window 930-1155 nm |
steps |
phi_max = 0.02 rad, gouy_step = 0.05 rad, 5416 steps |
run time |
45 passes in 15.6 min (cpu, scipy) |
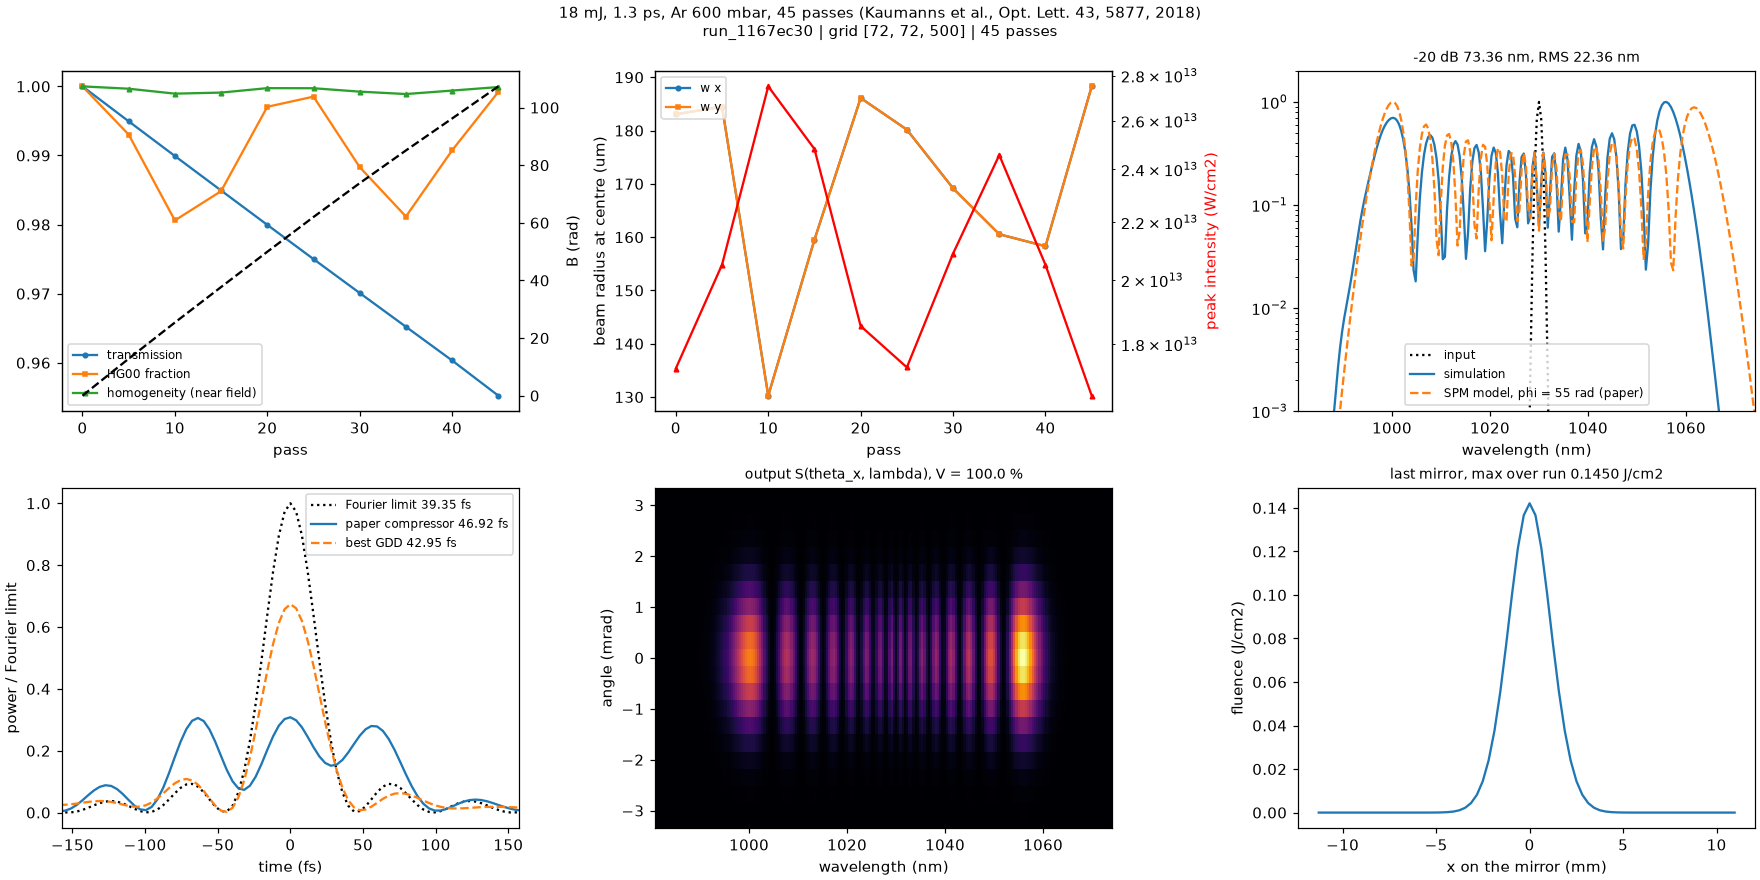
Fig. 6 Standard figure of the reference run. Top: transmission, HG₀₀ fraction, homogeneity and B-integral vs pass; beam radius and peak intensity at the cell centre; output spectrum (with the measured or published spectrum when available). Bottom: compressed pulses vs the Fourier limit; output spatio-spectral trace S(θ, λ); fluence on the last mirror.
Comparison with the paper
output |
simulation |
paper |
deviation |
status |
description |
|---|---|---|---|---|---|
|
183.1 um |
185 ±5% |
-1 % |
ok |
linear eigenmode waist (1/e2 radius) (0.37 mm diameter) |
|
2680 um |
2700 ±5% |
-1 % |
ok |
linear mode on mirror (1/e2 radius) (5.4 mm diameter) |
|
0.3236 |
0.5 |
-35 % |
input peak power / critical power |
|
|
0.9552 |
0.957 ±0.02 |
-0 % |
ok |
cell transmission |
|
107.3 rad |
55 |
+95 % |
B-integral, on-axis peak (55 (fit), 59 +- 6) |
|
|
4.680e-06 |
< 0.001 |
-100 % |
ok |
max fluence fraction outside 70 % of the box (should be ~0) (numerical check) |
|
1.002 |
< 1.17 |
-14 % |
ok |
M2 x (spectrally weighted) |
|
1.002 |
< 1.18 |
-15 % |
ok |
M2 y (spectrally weighted) |
|
39.35 fs |
39 ±10% |
+1 % |
ok |
Fourier limit (integrated spectrum) |
|
46.92 fs |
41 ±15% |
+14 % |
ok |
compressed with the paper’s -9400 fs2 (model 41.6) |
|
0.3082 |
0.62 ±0.1 |
-50 % |
off |
peak power / Fourier limit (paper GDD) (model 0.67) |
|
-8021 fs2 |
-9400 ±15% |
+15 % |
ok |
GDD maximising the peak power |
|
0.9999 |
> 0.967 |
+3 % |
ok |
homogeneity, intensity weighted in 1/e2 (x) (measured; the ideal cell can only do better) |
|
0.7634 |
1 ±0.05 |
-24 % |
off |
spectral similarity with the paper’s SPM model (phi = 55) |
Other outputs
output |
simulation |
description |
|---|---|---|
|
183.1 um |
injected waist (linear) |
|
106.4 rad |
B-integral, matched-mode estimate |
|
2.751e+13 W/cm2 |
max peak intensity at the cell centre |
|
0.1450 J/cm2 |
max fluence on the mirrors |
|
0.9992 |
HG00 fraction, output |
|
0.3170 |
beam-size oscillation (max-min)/w_in |
|
73.36 nm |
-20 dB spectral width |
|
22.36 nm |
RMS spectral width |
|
1029 nm |
spectral centre of mass |
|
42.95 fs |
compressed with the best GDD |
|
0.6739 |
peak power / Fourier limit (best GDD) |
|
149.1 GW |
compressed peak power (best GDD) |
|
0.9999 |
min homogeneity within FWHM |
|
0.9997 |
min homogeneity within 1/e2 |
Measured data
Curves digitised from the paper, in benchmark/ (see the header of each file for the figure and the units):
none committed yet
Reproducing
cd benchmark
python bench_kaumanns2018_18mJ.py --device cpu
python analyze.py kaumanns2018_18mJ