Graphical interface
pip install "thunder4d[gui]"
thunder4d-gui                 # or: thunder4d-gui cell.json
Four tabs, used from left to right. Everything is saved as standard input files (.json) and results
(.npz), so a session can be rerun or analysed from a script.
Design helper
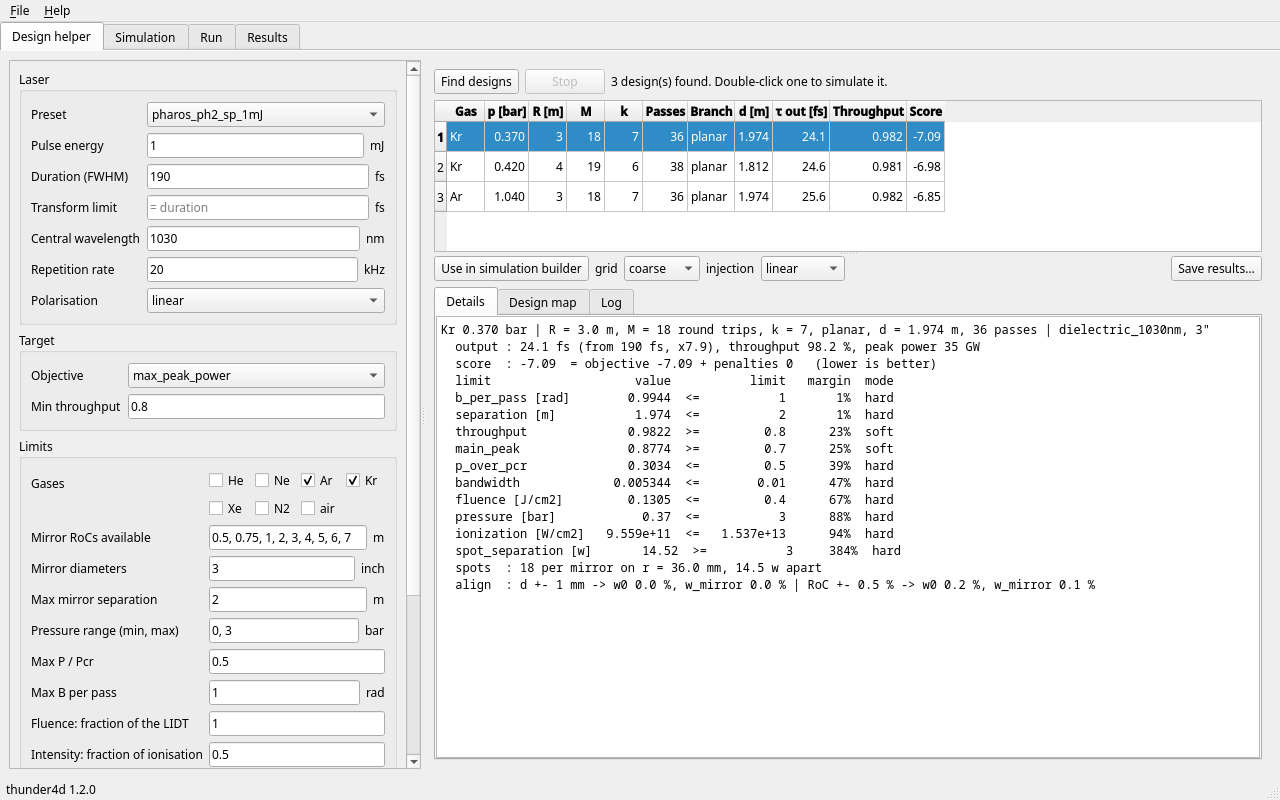
Pick a laser preset or enter the laser, set the limits and the search, then Find designs. The search of the design helper runs in the background (Fast 1+1D, or analytic for a first look); Stop ends it. Details gives the report of the selected design, Design map the pressure × round-trips plane around it. Use in simulation builder (or a double click) sends it to the next tab.
Simulation
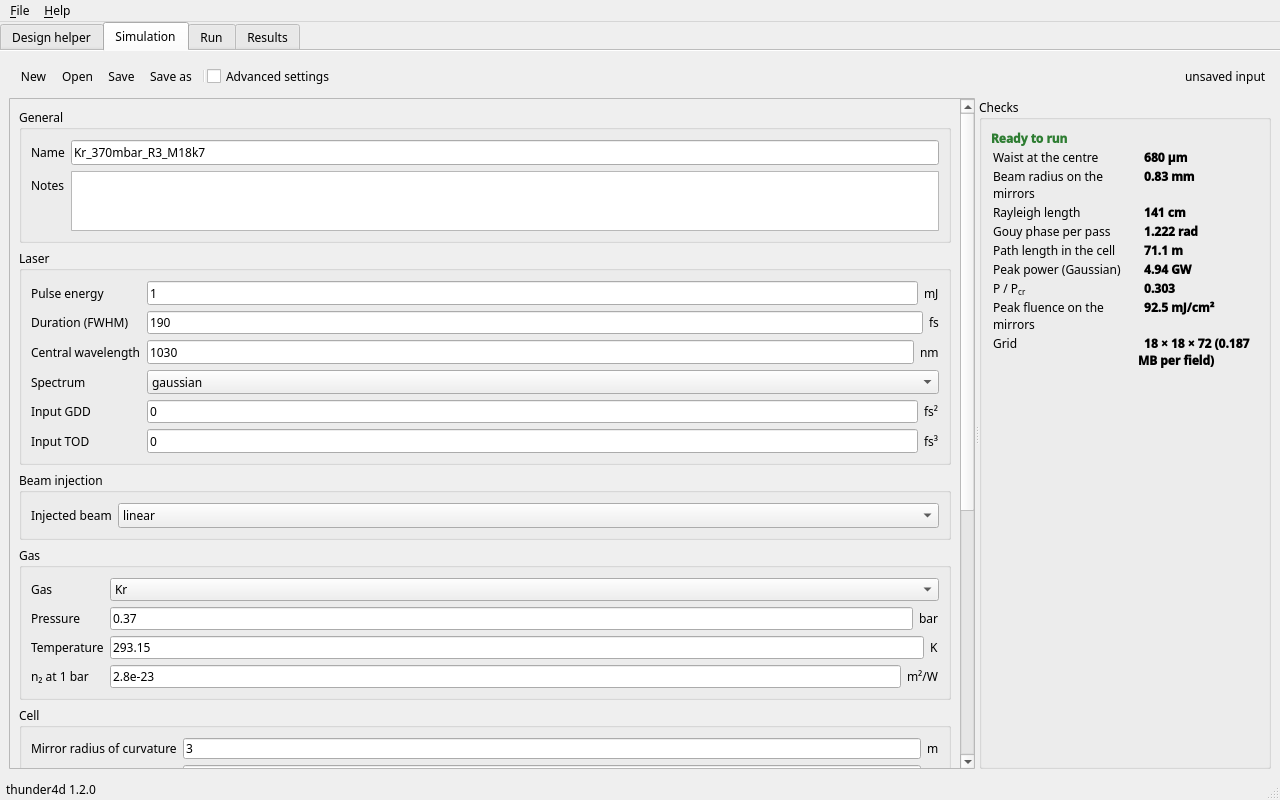
Every field of the input file, in readable units, checked while you type: a field at fault is framed in red and listed under Checks. A valid input shows its eigenmode, peak power and \(P/P_{cr}\), peak fluence on the mirrors and grid size. Tables (measured spectrum, mirror curves) are imported from CSV or pasted from a spreadsheet, first column in nm. Save is disabled while the input has problems.
Run
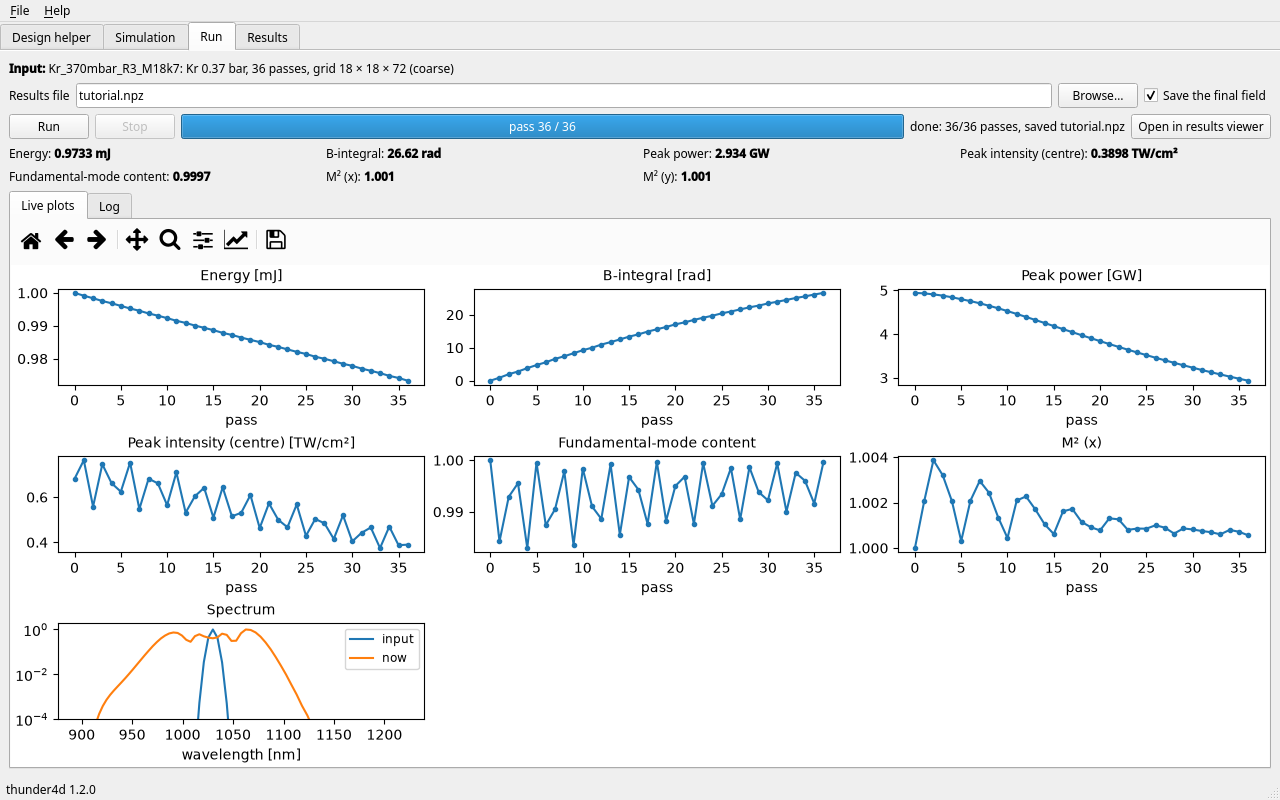
Runs the input pass by pass in the background, with the progress, the time left, and the energy, B-integral, peak power and intensity, mode content and \(M^2\) after every pass. Stop ends the run after the current pass and still saves it; so does an error.
Results
Opens the run that just finished or any saved .npz. The list holds the figures the run can draw:
evolution versus pass (transmission and B, peak power, beam size at the centre and on the mirrors,
beam quality, mirror fluence), spectra, the output and compressed pulse, fluence maps, \((x,\lambda)\)
and \((\theta,\lambda)\) spectrograms, mode content per colour. The slider selects the pass.
Export figure (PNG, PDF, SVG) and Export data (NPZ, or CSV for 1D data).
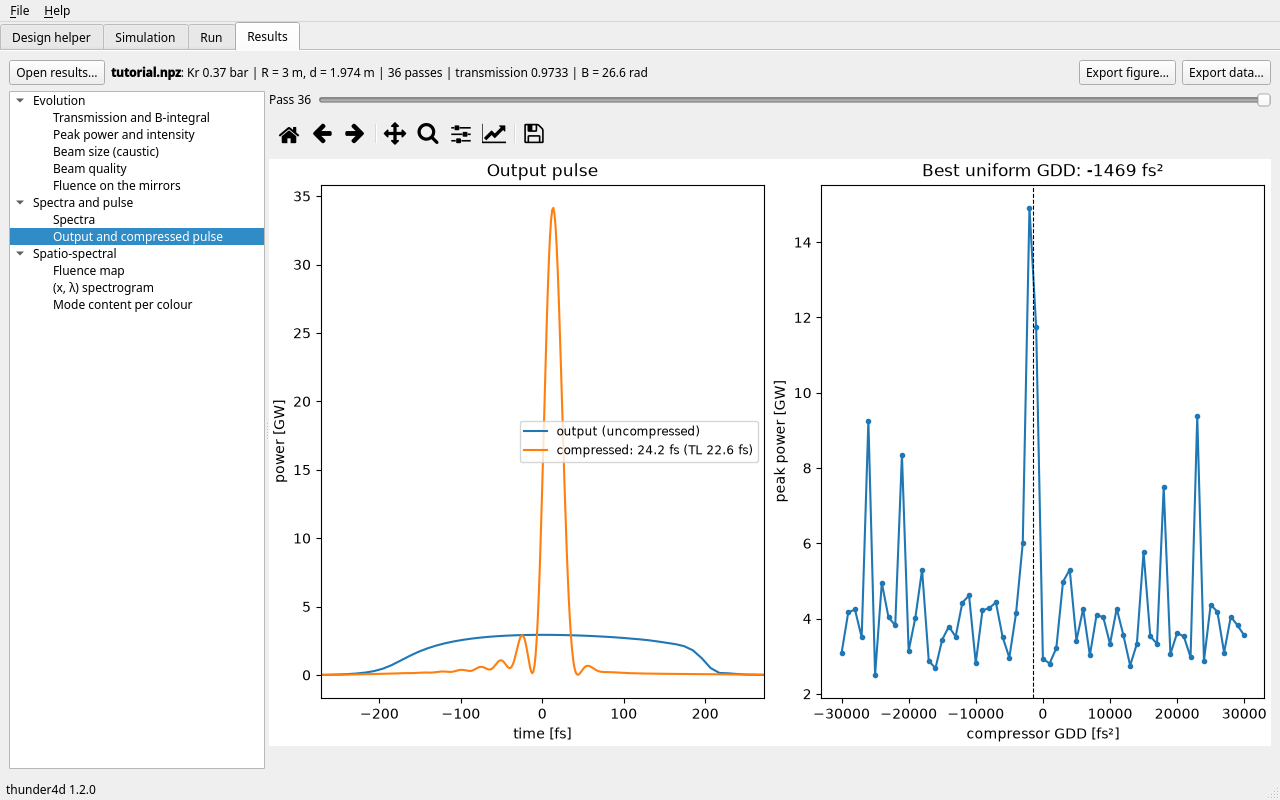
Fig. 4 Output of the design above: 24.2 fs, as predicted by the design helper (24.1 fs).
The screenshots are made by docs/gui_screenshots.py. To add a field, a figure or a tool to the
interface, see Development.