Benchmarks against experiments
Each benchmark reproduces a published multipass-cell experiment with the lens-frame solver and compares a standard set of outputs with the published values. The scripts are in benchmark/; their README.md explains how to run them, how to add one, and the format of the results.
How the comparison works
Reference values. Each script lists the published values it is compared with, each with a tolerance: relative (±%), absolute, or a bound (
<for a maximum,>for a minimum, e.g. the measured homogeneity, which an ideal simulated cell can only exceed). Values without a tolerance are shown for information only.Model vs paper. Each page starts with what the paper describes and what the script uses instead, when the paper leaves something out (input phase, mirror curves, …).
Calibrated parameters. When a parameter is set to an effective value instead of the published one (e.g. an energy, to account for pedestals or ASE that do not contribute to the nonlinearity), the page says so, with the reason. The quantity used to calibrate it is then not an independent test; the other outputs are.
Measured curves. Where available, curves digitised from the papers are overlaid on the figures and scored (spectral similarity, Fourier limit of the measured spectrum).
Regression tests. A short version of every benchmark runs in the test suite on each change of the code, and fails if the results move by more than 0.1 %.
Summary
Values are given as simulation (paper); values outside the tolerance are in bold.
benchmark |
checks ok / off |
Fourier limit |
compressed |
transmission |
M² (x) |
grid, run time |
|---|---|---|---|---|---|---|
11 / 0 |
26.04 fs (27 ±10%) |
26.85 fs (31 ±15%) |
0.9843 (0.96 ±0.03) |
1.001 (< 1.15) |
72×72×120, 1 min (cpu) |
|
10 / 2 |
39.35 fs (39 ±10%) |
46.92 fs (41 ±15%) |
0.9552 (0.957 ±0.02) |
1.002 (< 1.17) |
72×72×500, 16 min (cpu) |
|
Rueda et al. 2021: 0.29 mJ, 42 fs -> 8 fs, Ar 1500 mbar, 11 passes |
4 / 0 |
6.284 fs (6.2 ±10%) |
6.852 fs (8.06) |
0.7151 (0.737) |
1.003 |
120×120×360, 6 min (cpu) |
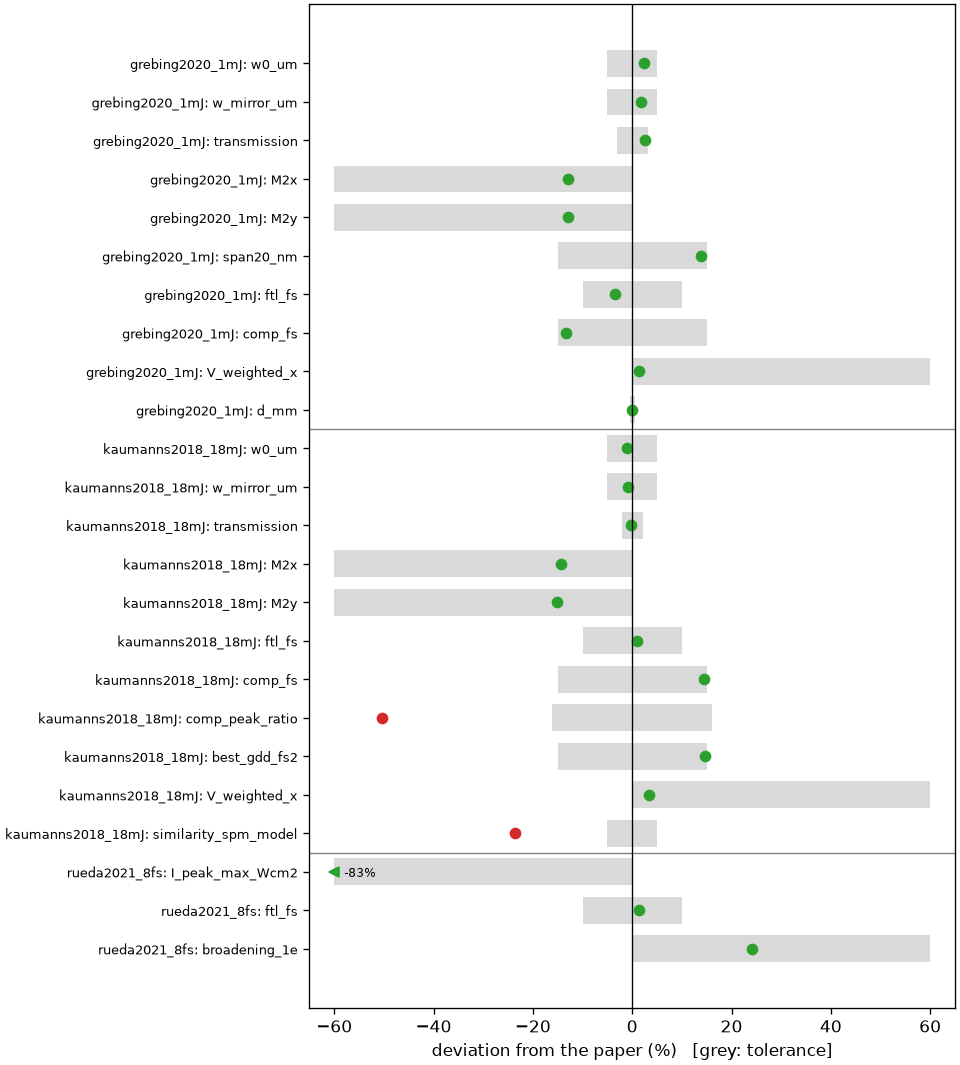
Fig. 8 Deviation of every checked output from the published value. Grey: tolerance (a band for ± tolerances, a half-plane for bounds). Green: within the tolerance; red: outside.